Valuing inclusion key evidence
Key evidence to accompany our Theory of Change
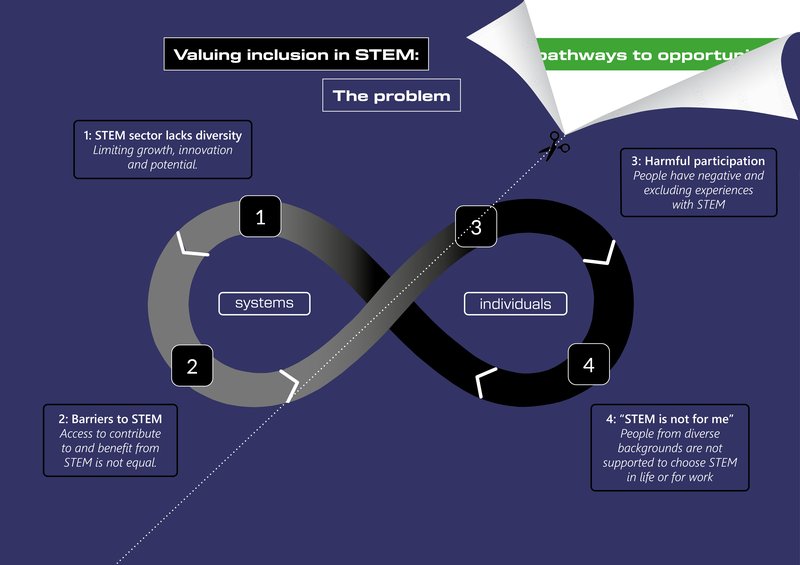
Problem statement
Lack of Diversity in STEM limits growth, innovation and potential
- The State of the Sector: Diversity and Representation in STEM industries in the UK (2020)
Data analysis brief presenting an overview of people working in the STEM workforce in 2019 to inform the All-Party Parliamentary Group (APPG) on Diversity and Inclusion in Science, Technology, Engineering and Maths (STEM) Inquiry into Equity in the STEM workforce in the UK. Secretariat: British Science Association - GOV.UK Supply of skills for jobs in science and technology (Current)
Providing statistics that highlight the supply and demand of skills in Science, Technology, Engineering and Mathematics (STEM) occupations to explore past trends, current statistics including gender diversity, and future projections for employment and education pathways into these roles. - Diversity matters even more, McKinsey & Company (2023)
Global consultancy McKinsey have demonstrated through a series of reports that, despite a rapidly changing business landscape, the business case for diversity, equity, and inclusion (DEI) not only holds, but has grown even stronger. This dataset draws on 1,265 companies, 23 countries, and six global regions, and multiple company interviews. This year for the first time, they also extended research and interview focus beyond the relationship between diversity and financial performance, to explore the significant holistic impact of diversity: environmental and social outcomes - including a more satisfied workforce. Download of the full report requires (free) log in.
STEM sector creates barriers to diverse participation. Access to STEM is not equal
- Public Opinion Trends Report, The Campaign for Science and Engineering (CaSE)(2023)
Just over 60% of people either agree that “R&D doesn’t benefit people like them” or feel neutral or unsure about R&D’s impacts. Public perception is that “Wealthy people” and “big businesses” are the major beneficiaries of R&D, and people view R&D activity as being clustered in London and South East England. Younger age groups are less likely to feel R&D benefits them or that R&D can create local jobs in their area. - Science Education Tracker, The Royal Society & Engineering UK (2023)
Young people have less access to STEM enrichment than in 2019 and those from less affluent backgrounds are less likely to have family science connections. Despite being a key motivator to learn science, access to hands-on practical has dramatically declined with only 26% of Year 10-11 (GCSE) students doing practical science at least fortnightly. - Mapping and analysis of science engagement and inequity in the UK, London Economics (2022)
The geography of science engagement looking at key indicators of opportunities to encounter and engage with science (e.g. number of science museums, science centres, higher education institutions, STEM related businesses). The report identifies 'hot spots' (predominantly in large cities) and 'cold spots' (including many costal/rural areas and former industrial heartlands) where there is limited science infrastructure). Commissioned by the British Science Association (BSA), and compiled by London Economics. - ASPIRES 3 Young People’s STEM Trajectories, Age 10-22, Archer et al. (2023)
ASPIRES research project is a fourteen-year, mixed methods investigation of the factors shaping young people’s trajectories into, through and out of STEM education. The study collected survey data from over 47,000 young people and conducted over 760 qualitative interviews with a longitudinal sample, which tracked 50 young people (and their parents/carers) between the ages of 10 and 22. Analyses of the ASPIRES survey and longitudinal interview data identified three main factors that shapes young people’s STEM trajectories: 'Identity' (the extent to which a young person’s identity is aligned, or not, with a STEM discipline), 'Capital' (forms of capital - cultural, social and economic resource - which can support sustaining STEM identity development and progression over time) and 'Field' (STEM settings, systems and practices which can undermine young people’s identification with, and progression in, STEM). The STEM education 'field' (settings, systems and practices) plays a key role in excluding and dissuading young people from continued study in science/STEM.
Harmful participation exists. People from diverse backgrounds have negative and excluding experiences with STEM
- Mapping and analysis of science engagement and inequity in the UK, London Economics (2022)
The geography of science engagement looking at key indicators of opportunities to encounter and engage with science (e.g. number of science museums, science centres, higher education institutions, STEM related businesses). The report identifies 'hot spots' (predominantly in large cities) and 'cold spots' (including many costal/rural areas and former industrial heartlands) where there is limited science infrastructure). Commissioned by the British Science Association (BSA), and compiled by London Economics. - ASPIRES 3 Young People’s STEM Trajectories, Age 10-22, Archer et al. (2023)
Specific assumptions, practices and behaviours in the STEM 'field' can undermine young people's identification with, and progression in, STEM (from primary through to secondary and university levels) and make it harder for young people from underrepresented communities to engage in STEM, even when they are highly interested and motivated to pursue STEM. These factors also increase the risks and costs of STEM participation for those from underrepresented communities.
“STEM is not for me”
- Public Attitudes to Science 2019 (PAS 2019)
The Science Capital Index (first introduced in PAS 2019), explored personal connection to science; the role of science in people’s lives; and how often people have conversations about science in their everyday life. Only 22% of UK adults reported high science capital. High science capital highly correlated with positive views about science. PAS 2019 demonstrated that science capital is unequally distributed across the population in terms of demographics (gender, age, degree level qualifications, limited ethnicity data). While people increasingly see science as important they were less likely (compared to 2014 data) to think science will make lives easier, that it’s important to know about science in their daily life, and that the science they learnt at school has been useful in daily life.
It should be noted that this survey is pre-pandemic. Results of the seventh iteration of the Public Attitudes to Science is expected in 2025. - Youth Insights Data, British Science Association (2023)
Research on what 14-18 year olds across the UK think about science and its role in their lives. Insights highlight a significant disconnect between young people and scientists in terms of personal connection and representation. Only 12% of young people believe scientists genuinely represent their views and values. 8% believe that scientists look like them. Girls are more likely to say ‘science is not for me’ and are less likely to feel connected to science.
Our intended impact
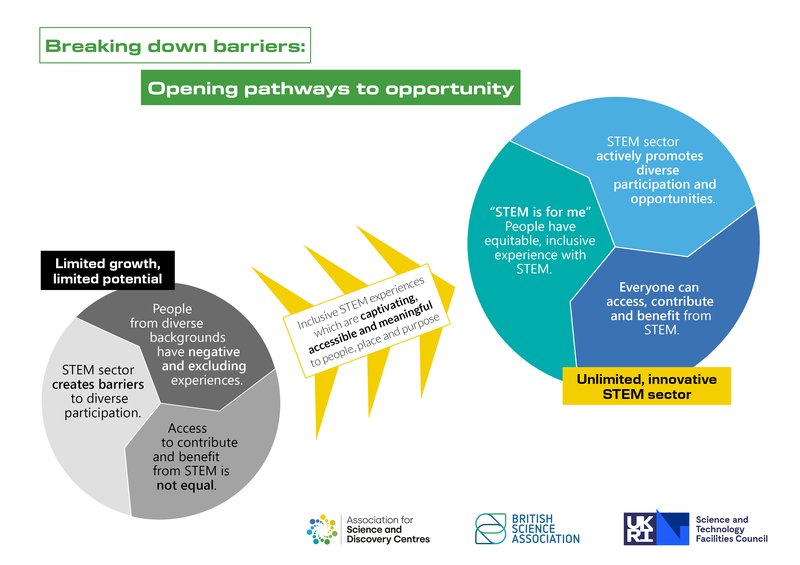
A future society where everyone can access, contribute and benefit from Science, Technology, Engineering and Maths.
- A fairer, STEM positive society where everyone can thrive.
- Increased innovation, problem solving, business performance and growth within a diverse STEM sector.
- STEM solutions that work for everyone.
How we get there
Inclusive, Informal STEM Learning plays an effective role in achieving this impact, through STEM experiences which are captivating, accessible and meaningful to people, place and purpose.
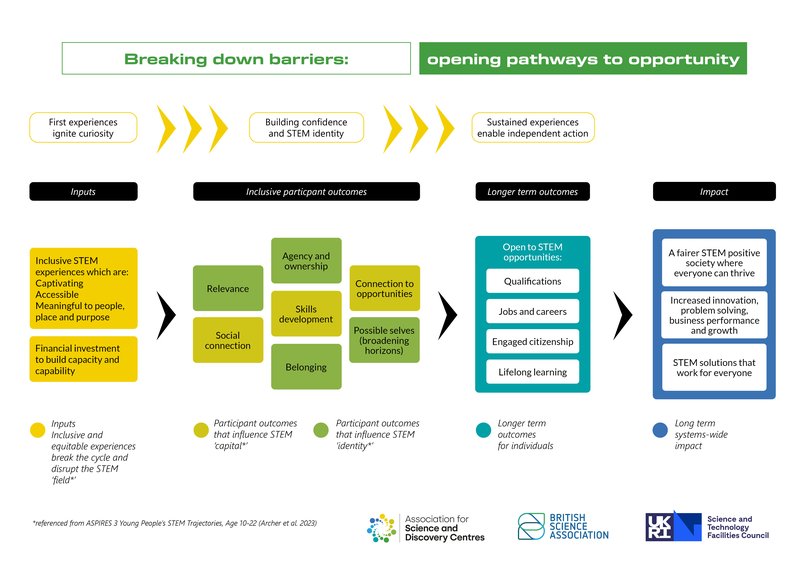
A STEM education and engagement sector that actively promotes diverse participation utilises STEM for meaningful, 'inclusive outcomes' for participants. These change mechanisms can build confidence and support STEM identity, opening new pathways, possibilities and opportunities.
- Agency and ownership: a person's capacity to act and take action in their learning and lives.
- Belonging: a sense of identity, recognition, value and acceptance which facilitates participation.
- Relevance: recognising people encounter and relate to STEM in many ways, be they contextualised in lived experience, everyday life, personal interests or wider social, political or cultural contexts.
- Developing skills: building essential STEM skills such as critical enquiry, problem solving, creativity and other 'higher order thinking' skills, alongside using STEM for social, emotional and development skills such as resilience and teamwork.
- Possible selves: the ability of science engagement to open up new aspirations and possibilities - broadening horizons and interests for future lives and work.
- Social connection: also termed 'social wellbeing', social connection with friends, family and others within the space, social connections are key motivator to attend, and huge contributors to positive experiences with STEM.
- Connection to opportunities: building STEM capital by providing clear connections to people, places and resources that enable independent action to engage with STEM through methods most suitable for them.
The following externally evaluated, national and international STEM and community engagement programmes were involved in the research of inclusive participant outcomes:
- Report 'Audience monitoring and science capital' commissioned by UKRI (NCCPE, ASDC, BSA, 2020) External link unavailable.
- Relationship + Engagement = Impact: Lessons learned from the evaluation of Explore Your Universe 4 (Jen DeWitt, 2022)
- Operation Earth Phase 2.5 Evaluation Report (Laura Thomas, 2022)
- Bold Futures (2022) External link unavailable. This programme was based on evidence within The Liminal Space research report Science and Discovery Centre Futures: Missions and Opportunities (2021)
- Our Space Our Future, EU Horizon2020 (Sophie Bartlett, 2022)
- Valuing Inclusion: Learning about science my way (ASDC, Laura Thomas 2023)
- Curiosity: BBC Children in Need (Substance, Graphic Science 2023)
Synthesis into the seven key outcome areas for participants involved consultation and focus groups with Informal STEM Learning professionals and partners led by the Association for Science and Discovery Centres (ASDC) between September 2022 – July 2024):
- Consultation and focus groups with Informal Science Learning practitioners and their community partners
- Consultation with Youth Workers, including drawing on Curiosity in Action (2023)
- Consultation with STFC (part of UKRI) and wider STEM and non-STEM funders
- Consultation with Informal Science Learning researchers and evaluators Professor Emily Dawson, Professor Louise Archer, Dr Helen Featherstone, Dr Sophie Bartlett, Dr Jen DeWitt, drawing on programmes such as YESTEM Equitable Youth Outcomes model
- Consultation with the the Impact and Insight Toolkit (Counting What Counts) and the ACE Participatory dimension categories within this, providing arts and cultural organisations (including ACE funded organisations) with a shared approach to evaluating the impact of their work on the people who experience it.
- Consultation with ASDC National Partners, Lewis Hou, Piotr Bienkowski, the Museums Association and key programme partner the British Science Association
These outcome areas are effectively delivered from initial moments and ignite curiosity, through multiple, sustained engagements that build confidence and enable independent action.
For additional evidence (programme reports and published papers) on the key themes within our Theory of Change please contact ASDC by email (this inbox is monitored regularly and we endeavour to reply within a week)